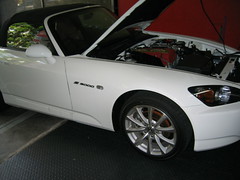
Kelvin came in for some oil servicing and a change of brake pads in preparation for next week's trackday... and he let me drive his car! :)
Steering is sharp and nicely weighted, suspension is firm, chassis is solid. Seating position is fairly low. Gear shift feel is excellent, clutch is light. Everything is within easy reach of the driver. Throttle response could be better. Torque is decent. Top end power is lacking though. Honestly can't see how folks can drive cars like this on the one hand and complain about "turbo lag" on the other.
Overall it is a decent, fun car. It's no highway monster that's for sure, but I can certainly see the owner enjoying a drive on twisty roads.
Saturday, April 28, 2007
Sunday, April 22, 2007

Wednesday, April 18, 2007

Tuesday, April 17, 2007
Never take things for granted
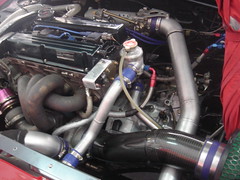
Today a new customer showed up with an Evo 9 GSR. Apparently his turbo blew on the way up to Sepang and he wanted to get it replaced; as he had some plans for more power the engine is being torn down and fitted with upgraded parts as well.
We were a little surprised that the static compression was measured to be about 9:1 instead of the widely acknowledged 8.8:1...
We were a little surprised that the static compression was measured to be about 9:1 instead of the widely acknowledged 8.8:1...
| Bore | 85mm |
| Stroke | 88mm |
| Piston dish volume | 128cc |
| Cylinder head volume | 440cc |
| Head gasket thickness | 0.95mm |
| Head gasket bore | 85.5mm |
| Compression ratio | 9.021:1 |
Monday, April 16, 2007
Time Attack 2007
Was a wash! Literally. Besides a light drizzle in the late afternoon, the heavily touted HKS Hipermax CT230R, piloted by pro driver Nobuteru Taniguchi, was to have given everyone a good show by challenging all comers to beat its best time around the track. Instead it set a FTD of 2'0x"xxx in the early morning session, but promptly experienced "mechanical difficulties" within 2 laps, and had to be pushed back into the pits! Didn't even get to see it perform since we got there only at about 1.30 pm...
Making things worse were that the other heavy-hitters from various workshops were also no-shows, meaning that it was just like any other trackday. i.e., about as interesting for observers as watching paint dry.
Overall it was a disappointing trip... on the bright side we managed to average about 9.5 km/l on the car despite driving with a fairly heavy right foot.
Wednesday, April 11, 2007
How to tune an electronic boost controller
First, the basics, starting with terms. "Wastegate" is a device that controls boost. There are internal (actuator or "flap" type) or external ("poppet" type) wastegates. An open wastegate reduces boost. A closed wastegate increases boost. Remember this.
"Duty Cycle" is the duration of valve opening time vs the available opening time, expressed as a percentage. i.e., if the valve is always open, then duty cycle is 100%. Conversely, if the valve is always closed, then duty cycle is 0%. Here's where it can get confusing. Depending on how the boost control is set up, an "open" valve may open or close the wastegate. You must know which way the valve is set up to avoid over-boosting.
On a TYPICAL setup:
INTERNAL Wastegate:
Valve open (100% duty cycle) = More boost
Valve closed (0% duty cycle) = Less boost
EXTERNAL Wastegate:
Valve open (100% duty cycle) = Less boost
Valve closed (0% duty cycle) = More boost
The simplest form of boost control is using open loop wastegate duty. Specify a wastegate duty cycle, and you're done! In fact this is how a manual boost controller works. There's a valve that is controlled by spring pressure, once manifold pressure exceeds a certain level,it diverts the manifold pressure to open the wastegate, reducing boost.
Since we're dealing with electronic boost control, we can add another dimension such as gear, vehicle speed, RPM or other form of load signal or input voltage, to vary the wastegate duty. Obviously this feature is specific to each boost controller, some of the more basic ones do not have this function.
Next up is closed loop control. Instead of blindly following a fixed wastegate duty cycle, or varying it by an arbitrary load value, the boost controller can control boost by looking at the target boost, comparing it with actual boost, and change the boost as appropriate. In essence a PID or PD controller.
The "P" stands for "Proportional" gain. "I", "Integral" gain. "D" is "Derivative" gain.
The proportional gain is used to determine the rate of response to a change in boost pressure. If gain is too low, the targeted boost level will never be reached. If gain is too high, there will be overshoot. If gain is just right, it will reach the boost target but there may be slight fluctuations, depending on how quickly the boost changes. This is where the integral gain comes in. It will smooth out the fluctuations if it is set correctly. If integral gain is too high the boost will oscillate and go out of control. The derivative gain is used to further remove any errors from the "I" term. Depending on the complexity of your boost controller, you may not have to set the "I" and "D" terms.
Here's a practical example: Blitz SBC i-Color. For manual mode, all you need to do is program the "SET" and the "GAIN". "SET" refers to valve opening duty cycle. Again, it is critical that you know what a valve opening of "100" means for your own set-up. If your boost is fluctuating around the target or overshoots, then "GAIN" is probably too high. If you never meet the target boost, then "GAIN" is probably too low. Auto mode is the same except that you don't even need to program "SET", just your desired boost.
In this way, practically all electronic boost controllers are the same. The differences lie in the implementation details e.g. using solenoid valve(s), stepper motor, sampling rate, additional sensors etc.
Legal disclaimer: the information above is for educational purposes only. The author shall bear no liability for the quality of the information presented. Follow the instructions at your own risk.
Friday, April 06, 2007
Mean piston speeds
UPDATE: OK Shaun, I get it... Mr Truth hahaha.... let's edit this post to better reflect what was meant. :)
Continuing from the last entry, let's say 25 m/s is the maximum permissible mean piston speed for any 4-stroke engine to be reliable.
Generally speaking, for the vast majority of street production engines, redline begins when mean piston speeds are about 20 m/s. In practice it is possible for certain engines to have mean piston speeds go beyond 25 m/s, with peak piston speeds far higher.
Whether it is desirable to do so or not due to possible additional gains in horsepower, is not the focus of this post. Instead, this is a general observation of what constitutes manufacturer-imposed rev limits on production engines. Obviously access to logs, experimental data and even experience would yield a better picture of what is a "safe" rev limit, but the difficulty is compounded by the definition of "safe". Does "safe" mean an engine of a certain configuration can last 1000 miles? 10K? 100K? However it is undisputed that revving an engine to high speeds will directly contribute to increased wear and mechanical loads being placed upon it.
With that out of the way... perhaps we can get into some observations.
For a stroke of 88mm as found on a stock Evo, 25 m/s is reached at 8500 RPM. Redline on the car begins at 7000 RPM, where mean piston speeds are 20.5 m/s.
For a stroke of 94mm as is commonly found on 2.2L engines, 25 m/s is reached at 8000 RPM.
For a stroke of 100mm (e.g. 2.4L engines), 25 m/s is reached at 7500 RPM.
For a stroke of 39.4mm, M.P.S. of 25 m/s is 19000 RPM. Sound familiar? It should.... because that's the rev limit of current 2.4L V8 Formula One engines. This is definitely not coincidence. Rules aside, is there a reason why they do not rev higher?
Thursday, April 05, 2007
Rev limits
As engine speeds increase, friction made by contact with the piston/oil rings and the cylinder walls as well as other rotating parts such as the cams, main bearing, rod bearings etc increase as well. However these are not the major problems limiting engine speed. Piston speeds and the instantaneous acceleration forces, are the limitations. We have yet to find a material tough enough to continually withstand the g-forces of high speed engine operation.
Mean piston speed can be easily calculated. It is simply the stroke multiplied by the RPM, multiplied by 2 since the piston travels the length of the cylinder twice per revolution. So for an engine with a stroke of 88mm, revving at 7000 RPM, the mean piston speed is 88 * 7000 * 2 = 1,232,000 mm/min. Since there are 1000 mm per meter, and since there are 60 seconds per minute, we can divide the 1,232,000 by 60,000, which gives us 20.53 m/s.
The generally accepted figure for mean piston speeds are between 20-25 m/s for high speed production sports car and motorcycle engines.
Now you will be asking why is this important to know. Here's where it gets interesting. It turns out that a piston does not accelerate at a linear rate. At top dead center and bottom dead center, piston speed is close to zero. For a frame of reference, 20 m/s is 72 km/h. Thus the g-forces acting on the gudgeon pin, rod, rod bearings etc are immense... a piston weighing 260g would now weigh about 2 tons! And this happens 233 times per second...
Tuesday, April 03, 2007
More basics
Brake specific fuel consumption (BSFC) is the mass of fuel, in pounds, that is burned per hour to produce one brake horsepower. Normally this value is determined from an engine dyno since both fuel flow and engine output are measured. However based on empirical data, there is a range of BSFC that are typical of certain engine types.
For example, turbocharged engines typically see BSFC values of 0.6 to 0.65, supercharged engines 0.55 to 0.6, and naturally aspirated engines between 0.45 to 0.5. Of course, it is possible to lower BSFC (some would even say that is the goal of upgrading the engine), with competition NA engines going below 0.45... but not at full power though.
The mass of air that actually enters an engine's cylinders as compared to its theoretical maximum is called the volumetric efficiency (VE). Again, we normally measure this value instead of deriving it mathematically. It is more or less analogous to "boost pressure".
The point of all this is to get a vague idea of the VE that is necessary to achieve a targeted power level based on some simple calculations.
Let's take an Evo 9 as an example. The engine is 1997 cc or 121 cubic inches. Let's say it has a BSFC of 0.60 at peak power, and based on our real-world dyno experience it produces 320 bhp @ 6500 RPM when running an AFR of 12.5:1.
Thus, the VE is 9411 * 320 * 0.6 / (121 * 6500) = 2.297, or about 1.3 bar of boost. Pretty accurate.
Another example... the F20C of the Honda S2000. Also 2L in capacity, let's use a BSFC of 0.45... VE is then 9411 * 247 * 0.45 / (121 * 8600) = 1.00... practically 100% VE. Perfectly possible with a good flowing head.
S54 engine of the M3 CSL... 3.2L or 193.6 cubic inches. VE is thus 9411 * 360 * 0.45 / (193.6 * 7900) = 99% VE
Remember, this is not rigorous but should give a decent idea as to what's possible with what kinds of mods...
Normally aspirated 2.4L doing 300 whp...
Recently there have been rumors of a normally-aspirated 2.4L Honda engine doing "300 whp" prowling the streets of Singapore. Let's evaluate the claim.
Based on a popularly optimistic dyno, 300 whp would translate to about 360 brake horsepower, assuming losses of 16.5%. By way of comparison, the S54 engine (3.2L inline 6) found in the BMW M3 CSL needs all of 7900 RPM to produce similar power. So a top of the line engine from BMW M division, with greater displacement and more revs, thereby flowing much more air, only produces the same power as an engine with 2 fewer cylinders, 25% less displacement and less revs. Right.
Let's dig deeper.
Brake Mean Effective Pressure (BMEP) is a synthetic engine performance index; it does not give actual cylinder pressure but affords us a good idea of what is possible for a particular engine in discussion. It can be derived by taking the torque in lb-ft, multiplying it by 150.8 and dividing the result by the engine capacity in cubic inches. A 2 liter engine would be about 122 cubic inches.
A 2006 Nextel Cup Car with a stroke of 3.25" produces 840 HP @ 9000 RPM. Torque would thus be 490 lb-ft. For such an engine, BMEP would be 206 psi. Peak torque is said to be about 550 lb-ft, or BMEP of 231 psi.
Remember, we are dealing with normally aspirated engines, so this is about as good as it gets.
Formula 1 engines: 2.4L V8, approximately 750 bhp @ 18500 RPM. BMEP of 219 psi at peak power.
2007 Porsche 911 GT3 RSR. This is a naturally aspirated monster. With just 3.8 liters of displacement, and FIA restrictors in place it produces 485 bhp @ 8500 and 320.8 lb-ft @ 7250. Running with a compression ratio of 14.5:1, it requires 100 octane fuel to avoid detonation. BMEP on this car at peak torque is "just" 209 psi.
For this mythical K24, stroke would be 3.9". Due to piston speed limitations, let's just say it produces its peak power of 360 bhp @ 8000 RPM. Thus torque would be 236 lb-ft. BMEP at peak power is 243 psi!
Perhaps next year's Nextel Cup and FIA GT cars should run on this K24 instead!
Bonus credit: With a 3.9" stroke, this 2.4L engine will be pushing mean piston speeds of 5200 fpm @ 8000 RPM, or 26 m/s. That's like revving the famous F20C engine in the Honda S2000 to 9455 RPM, when factory rev limit is 8600...
In view of such extreme real-life examples, we are forced to conclude that it is highly improbable that a 2.4L engine of such dimensions, revving at 8000 RPM, naturally-aspirated, is capable of producing 360 bhp.
Power vs velocity graph
 Approximate horsepower required to overcome air resistance for a vehicle with Cd of 0.36 and frontal area of 2.318 square meters. Something like an Evo. ;)
In reality, additional factors such as rolling resistance, drivetrain losses, pitch angle, lift and so on should be considered before more detailed calculations to predict required horsepower vs velocity are attempted.
A change in Cd of 0.01 would yield about 2.78% difference in required horsepower.
Subscribe to:
Comments (Atom)