A few more sample points were added, and one of the outliers removed (driver missed a gear). R-squared is now 0.99. The table formatting has also been replaced with Excel screenshots, allowing most browsers to render the page faster.
Decided to investigate the relationship between 1000ft and 1/4 mile timings based on a discussion with Shaun.
To tackle this problem I turned to Google for actual reported time slips as well as Gtech timings. I've also included some samples from my own database of Gtech runs. Drag strip, street surface, FWD, RWD, 4WD, automatic, manual, slicks, street tires, NA, turbocharged, nitrous'ed, even sports bikes were included in the data. About 80 sample points in total.
The data was then entered into an Excel spreadsheet and linear regression analysis using the least squares method was performed.
Here are the results (click on the images to get a higher resolution picture):
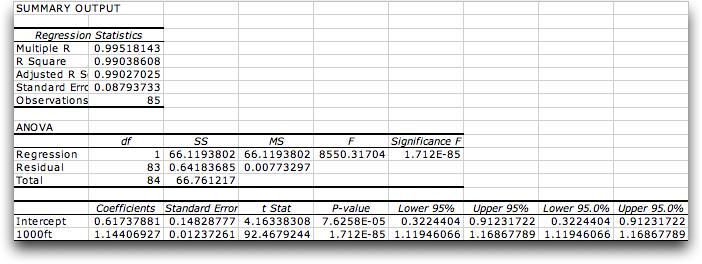

In summary, the following equation can be used to predict 1/4 mile timings (for vehicles running between 10 and 14 sec 1000 ft times):
Predicted 1/4 mile timing = 1.144 * 1000 ft ET + 0.617
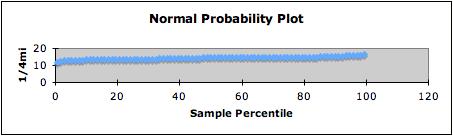
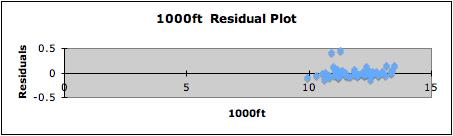
Stephen asked about the validity of the equation for very powerful vehicles. As can be seen from the residual plots, the samples are doing between low 10s to 14s 1000 ft numbers. It has been observed that the gradient would hold but the intercept would need to be altered to reflect this. For vehicles in the 8s category, the intercept would be 0.3, instead of 0.6. Here are some real life examples:
1. Sport Compact class
http://www.nhrasportcompact.com/2005/events/race05/results/hr.html
Saturday for Ron Lumnus
1000 ft: 6.617
Previous predicted 1/4 ET: 1.146 * 6.617 + 0.3 = 7.883
Predicted 1/4 ET: 1.144 * 6.617 + 0.3 = 7.869
Actual 1/4 ET: 7.837
Previous error: 0.046
Error: 0.032
Sunday for Ron Lumnus
1000 ft: 6.652
Previous predicted 1/4 ET: 1.146 * 6.652 + 0.3 = 7.923
Predicted 1/4 ET: 1.144 * 6.652 + 0.3 = 7.91
Actual 1/4 ET: 7.864
Previous error: 0.059
Error: 0.046
2. Pro-stock class
http://www.nhra.com/2005/events/race06/results/ps.html
Kurt Johnson
1000 ft: 5.716
Previous predicted 1/4 ET: 1.146 * 5.716 + 0.3 = 6.850
Predicted 1/4 ET: 1.144 * 5.716 + 0.3 = 6.839
Actual 1/4 ET: 6.837
Previous error: 0.013
Error: 0.002
Jeg Coughlin
1000 ft: 5.719
Previous predicted 1/4 ET: 1.146 * 5.719 + 0.3 = 6.854
Predicted 1/4 ET: 1.144 * 5.719 + 0.3 = 6.843
Actual 1/4 ET: 6.839
Previous error: 0.015
Error: 0.004
Warren Johnson
1000 ft: 5.719
Previous predicted 1/4 ET: 1.146 * 5.719 + 0.3 = 6.854
Predicted 1/4 ET: 1.144 * 5.719 + 0.3 = 6.843
Actual 1/4 ET: 6.834
Previous error: 0.02
Error: 0.009
Dave Connolly
1000 ft: 5.698
Previous predicted 1/4 ET: 1.146 * 5.698 + 0.3 = 6.829
Predicted 1/4 ET: 1.144 * 5.698 + 0.3 = 6.819
Actual 1/4 ET: 6.814
Previous error: 0.015
Error: 0.004
Conclusion: with sufficient data it would be trivial to accurately predict 1/4 mile timings based on 1000 ft ET's. :)
1 comment:
what??? R-squared of 0.95!!! You have just confirmed your relationship!! My thesis R-squared never went close to 0.15!!! hahah... but my observations were close to 5,000
Post a Comment